Resource: Smartphone Usage and Internet Costs in South Africa
GeoPoll conducted a study examining how South Africans use their phones, what features and applications they use most often, and how much they are paying for mobile services.
Background: Mobile Phones in South Africa
South Africa is one of the biggest adopters of mobile technology in sub-Saharan Africa, with higher rates of smartphone adoption than in most other countries in the region. A study by Pew Research in 2018 found that 51% of adults in South Africa own smartphones, and an additional 40% own a basic mobile phone. In terms of total numbers, it has been found that there are 46.9 million smartphone subscriptions in South Africa, which accounts for users who have multiple phones. As smartphone penetration continues to grow in South Africa, so does the development and use of smartphone apps for messaging, transportation, streaming, and more.
Despite high rates of smartphone adoption, South Africa is plagued by high data costs which have resulted in protests and fierce competition between the country’s leading mobile network operators including MTN and Vodacom. It has been found that data costs in South Africa are more expensive than those found in other sub-Saharan African nations including Kenya, Nigeria, and Ghana. In December 2019 a report by the Competition Commission highlighted the price disparities between countries, and stated that poorer customers are forced to buy smaller data packages due to cost, limiting their capabilities. Given that a majority of mobile users in South Africa are using mobile phones as their primary way to access the internet, the high costs of data remain a challenge for many.
In order to better understand how South Africans are using their phones, what features and applications they use most often, and how much they are paying for mobile services each month, GeoPoll conducted a study with 400 South Africans via mobile web link.
Methodology
This study was conducted in February 2020 among 400 respondents in South Africa, with a 50-50 male-female split, and 33-33-34 split between ages 18-24, 25-34, and 35+. Respondents were roughly nationally representative across the 9 provinces in South Africa.
Surveys were sent via mobile web, meaning respondents received an SMS message with a link that opened in a browser within their phone. Due to this methodology, all respondents had access to the internet when they took the survey, and 398 out of 400 respondents reported that they own a smartphone, as opposed to a more basic phone with internet access.
Results: Phone Usage in South Africa
Phone Types
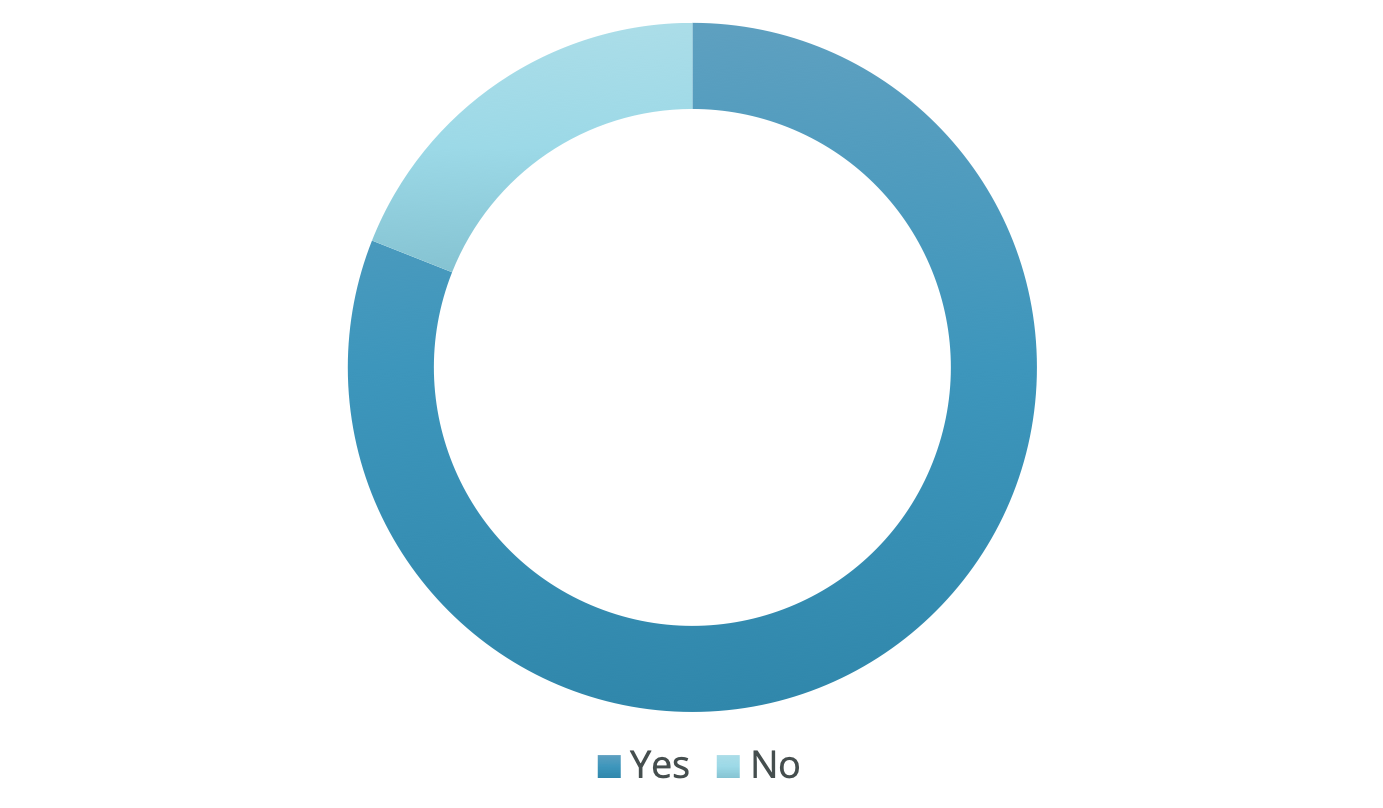
60% own more than one phone with people split on why they have multiple phones, with business/personal use, different services used, and to have a backup being the main reasons
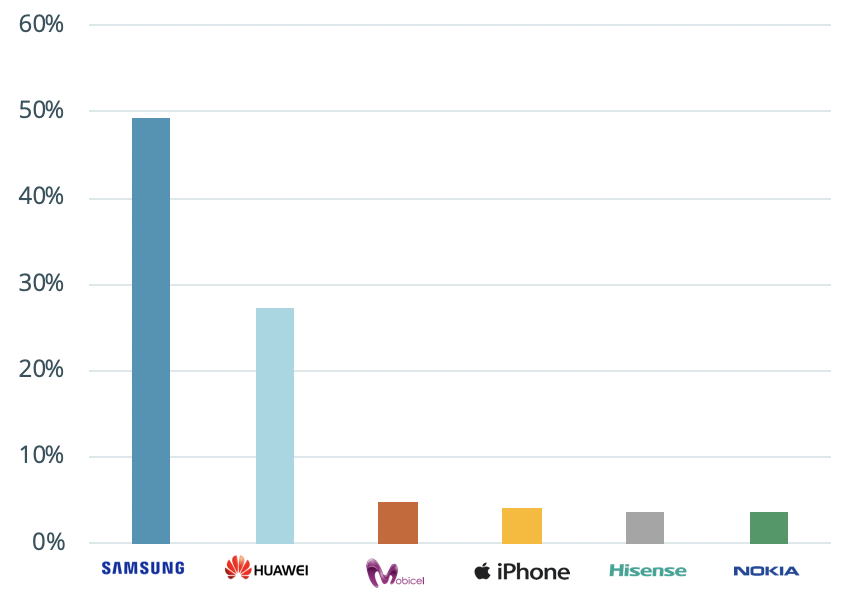
Samsung (49%) and Huawei (27%) are the most used phone brands. The dream phone for most is an iPhone (46%), followed by a Samsung phone (27%), with the most wanted Samsung phone being a S10.
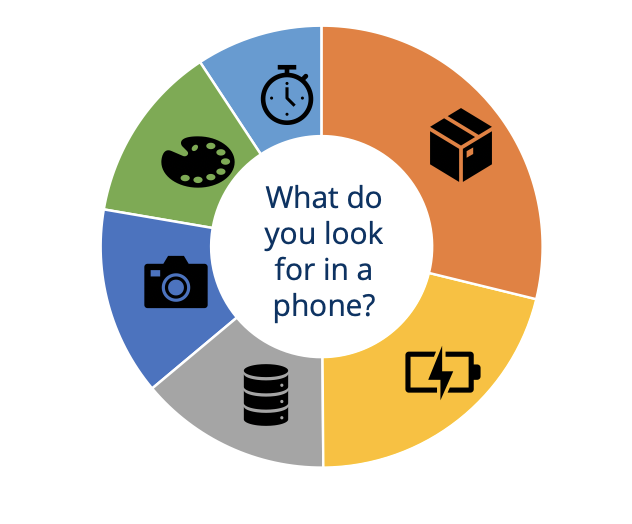
Storage space (29%) is the most important factor in a phone, followed by a long lasting battery (21%). A good camera and a large enough ROM (both at 14%) are also important.
Phone And Data Costs
Monthly Spend on Phone Services
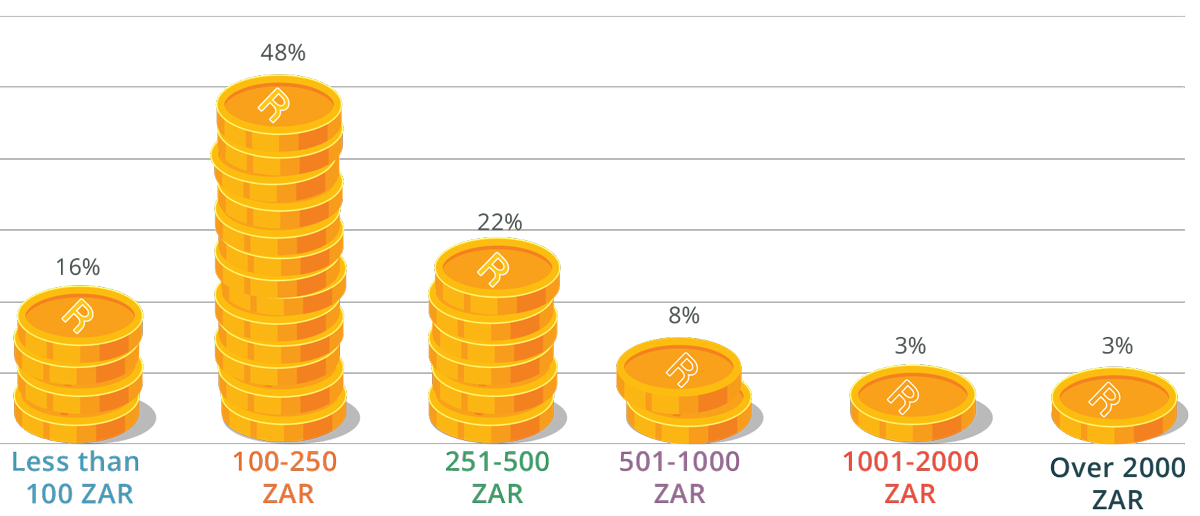
The majority of respondents, 70%, spend between 100 – 500 ZAR ($6.60 – $33 USD) on phone services per month, with 48% spending between 100 – 250 ZAR. Males spend more than females on phone services.
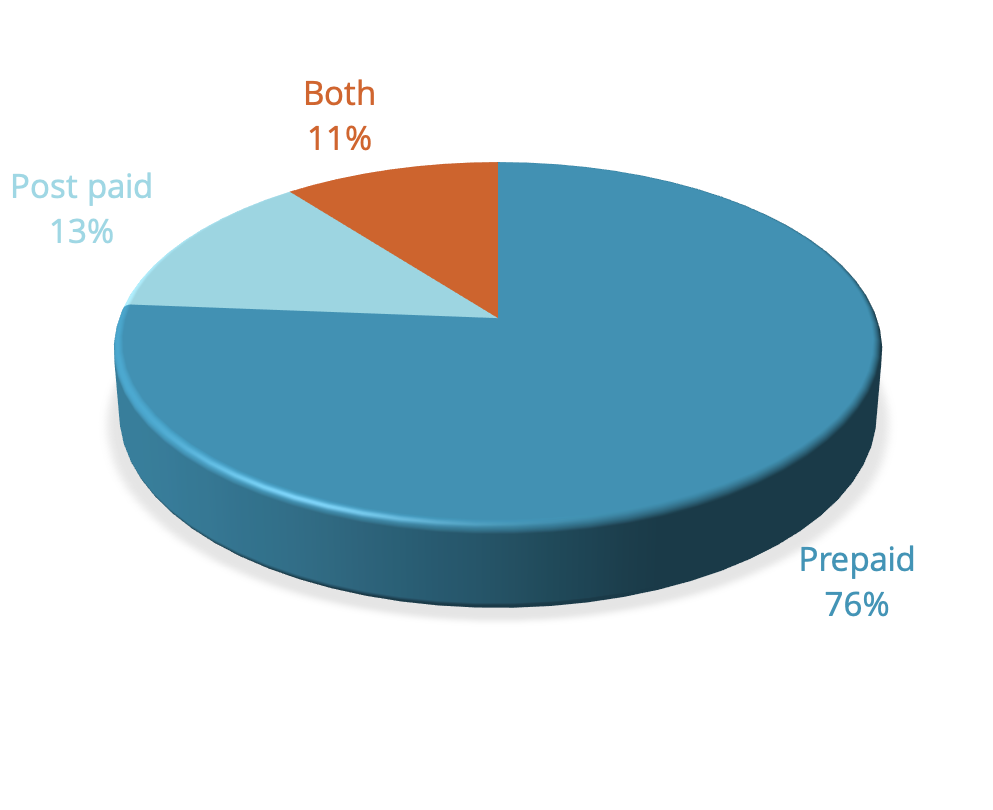
Most phone users are on prepaid plans (76%) compared to just 13% on post paid. Noting that over 59% of the respondents said they have more than one SIM card, 11% said they have both prepaid and post paid plans.
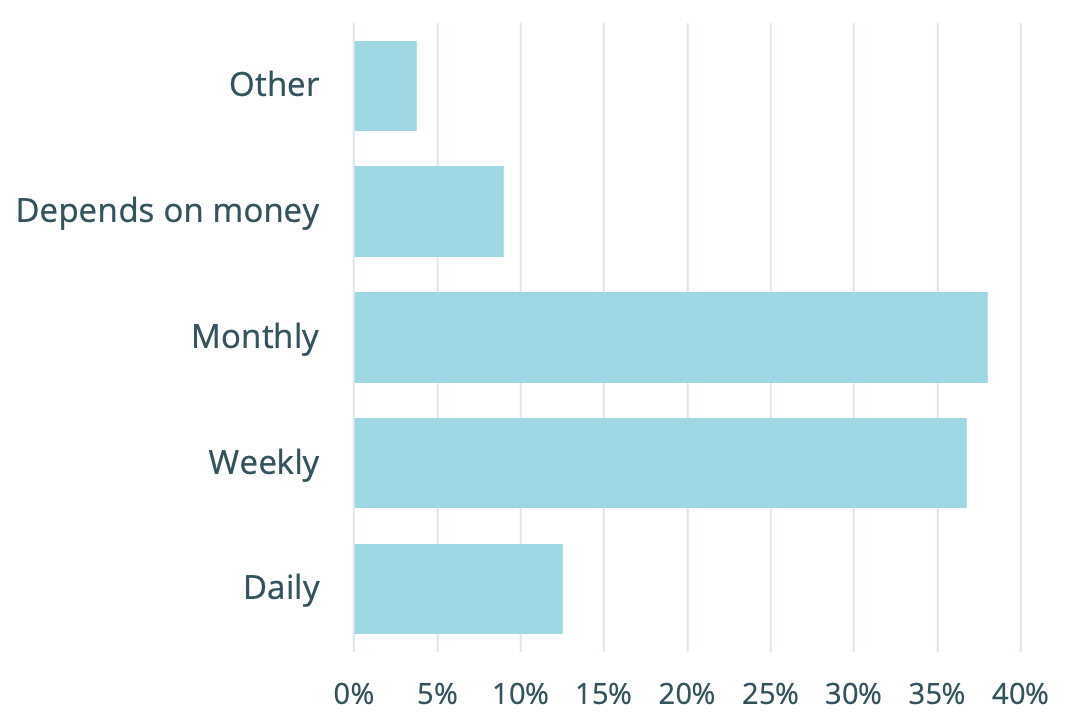
Respondents purchase mobile data either weekly or monthly, with 37% purchasing weekly and 38% monthly. 36% do not have a regular purchasing pattern, instead opting to buy mobile data only when they have the money to buy.
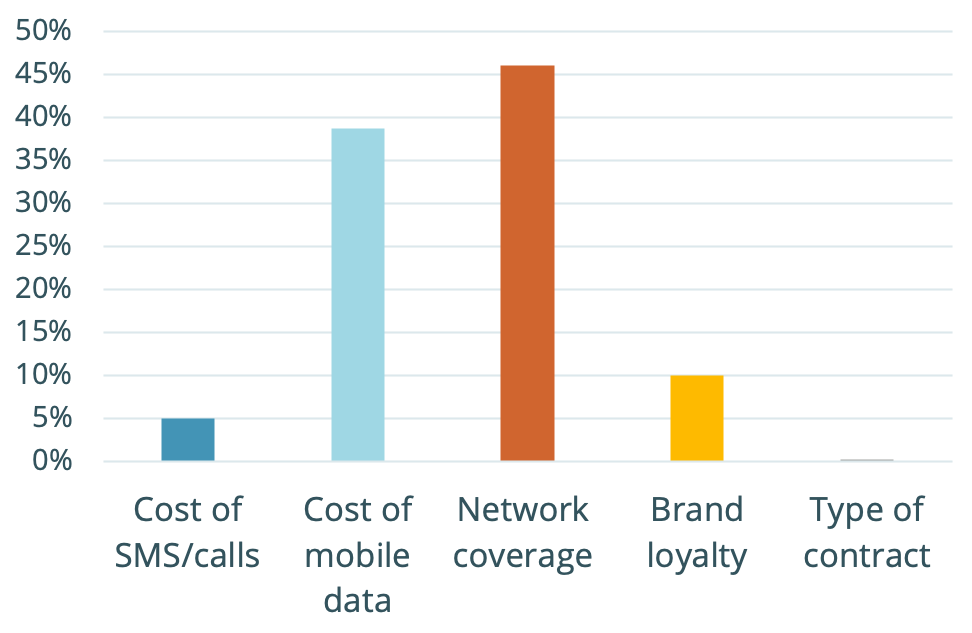
Cost and reliability are the biggest factors in choosing a mobile phone network, and 86% choose mobile networks based on deals they are running. 40% say it is very likely they would switch mobile providers due to cheaper data deals elsewhere!
Phone Plans
Purchasing Patterns
Choice of provider
App Usage
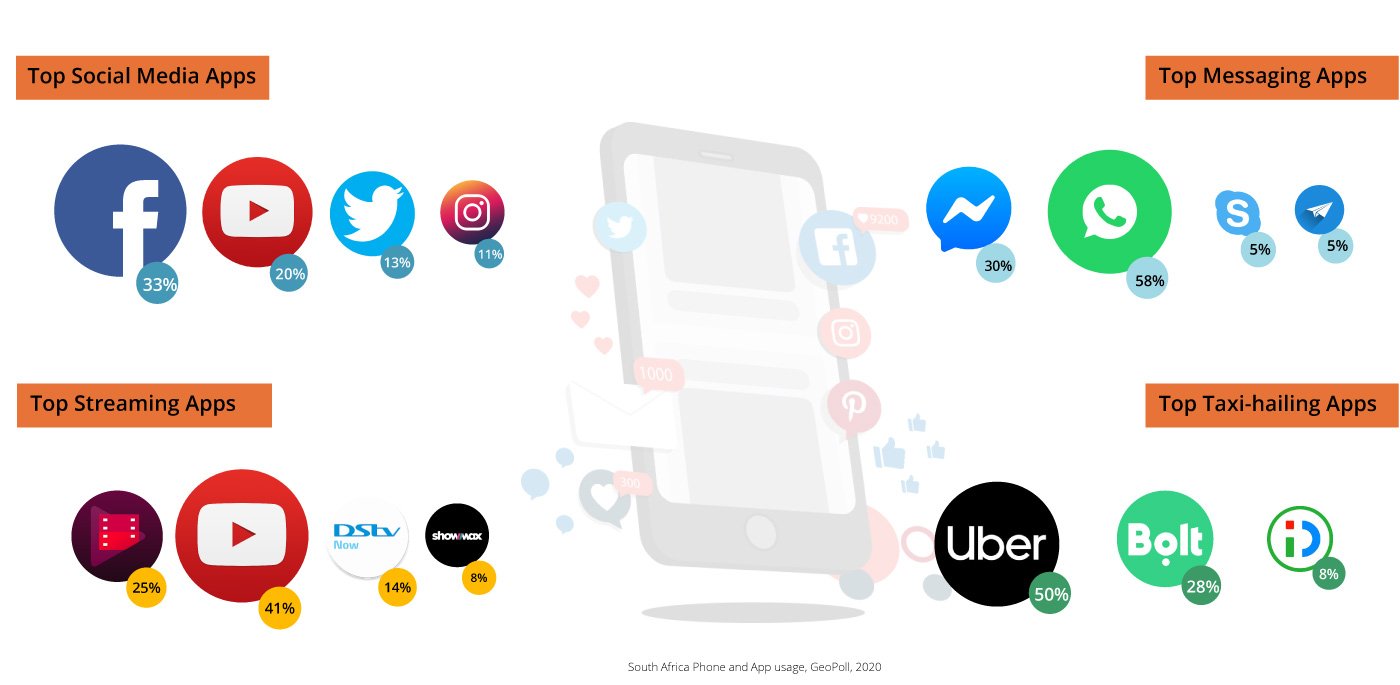
WhatsApp (58%) and Facebook Messenger (30%) are the most popular messaging Apps in South Africa. Our survey found out that males are more likely to use WhatsApp while females like Facebook Messenger more. Widening the questions to the larger social media, Facebook (33%), YouTube (20%) and Twitter (13%) were the most popular social media apps.
YouTube tops the chart of the most used video and music streaming Apps, with 41% of the respondents saying they streami videos on YouTube. Google Play (25%) and MultiChoice’s on-demand Dstv Now (14%) completed the top 3.
Looking at transport, Uber (50%), and Taxify (28%) dominate a taxi-hailing Apps category that is mostly popular with the youth.
Time Spent On Smartphone Functionalities
Internet takes up the most time of phone functions, with 45% saying they use the internet on their phone more than 4 hours a day. Of applications, time is most spent on messaging apps – 40% spent 4+ hours daily on messaging apps, followed by social media apps – 36% use social media apps 4+ hours daily. Females spend more time on both messaging apps and social media apps.
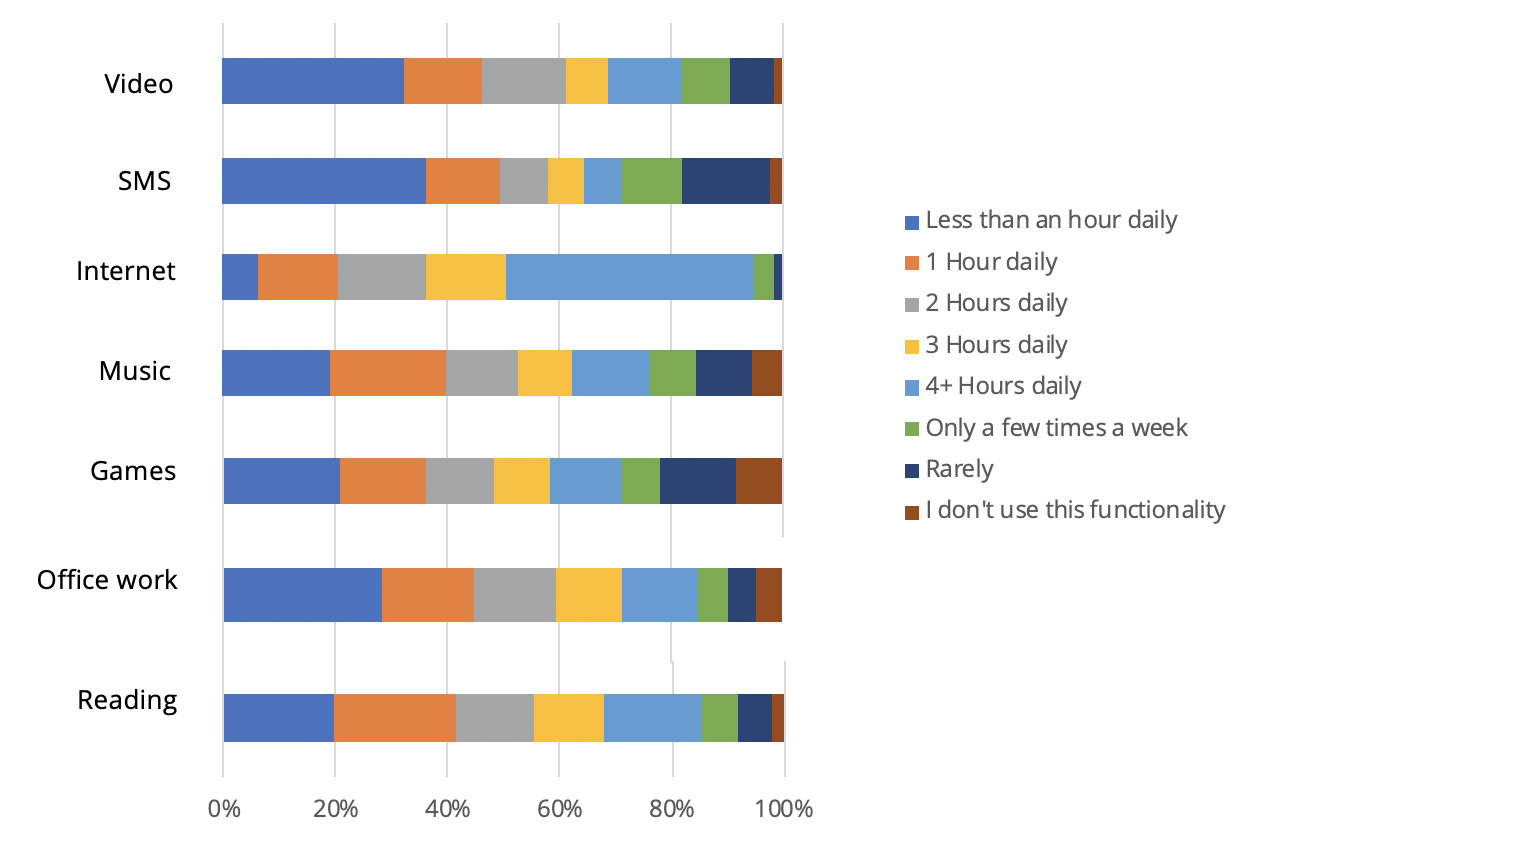
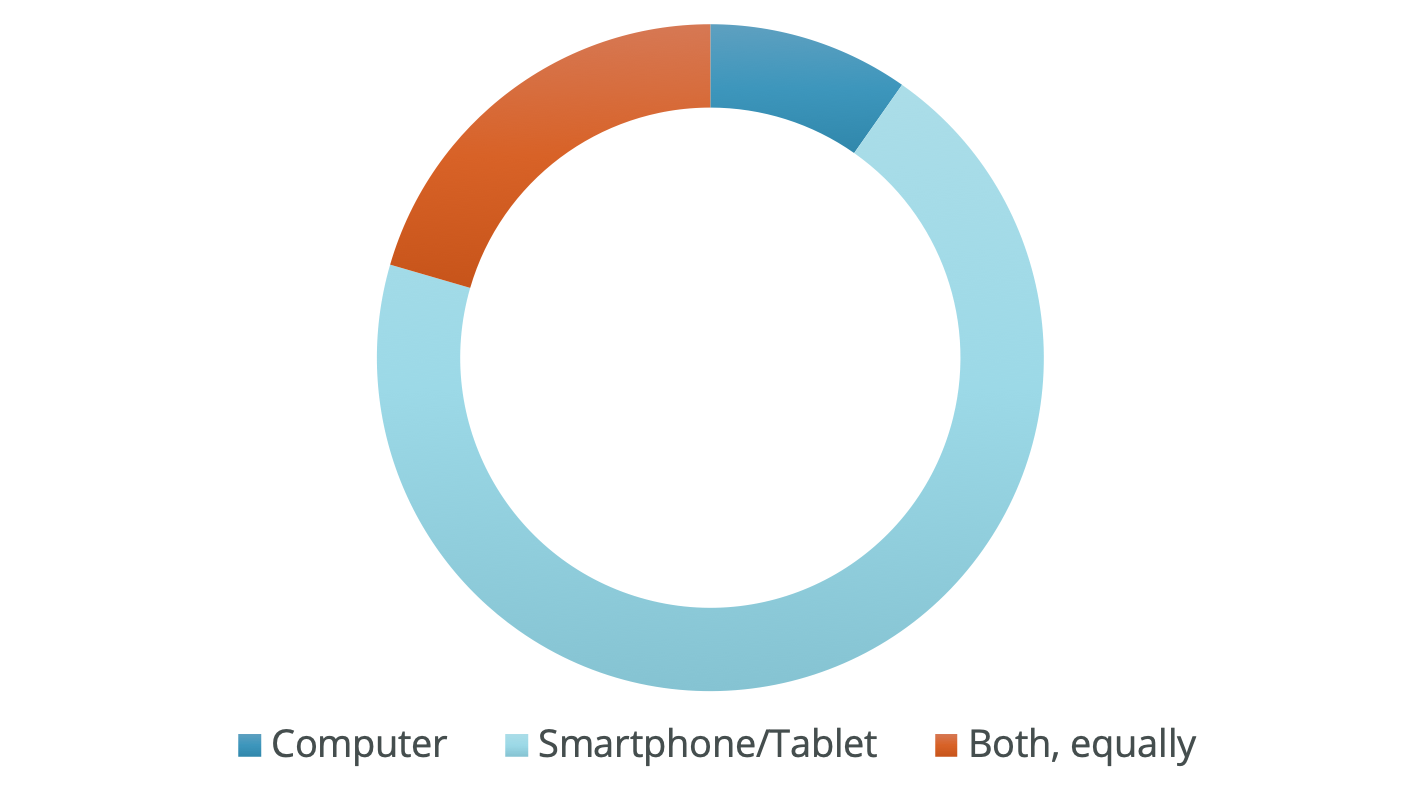
The internet is so important that 99% of respondents classify internet as a must-have part of a mobile phone, and 70% access the internet mostly through a smartphone or tablet compared to just 10% who browse the internet mostly on computers. This confirms that for website owners and developers in South Africa, mobile must be a priority
Which device do you access internet on?
Does South Africa have good mobile internet?
