The media landscape in Kenya has evolved over the past few years. 2020 was, particularly, a unique year with the challenges of COVID-19 pandemic restrictions. The media landscape, just like other categories, experienced shifts driven by changes in consumer lifestyles, tastes, and needs. Many of these changes spilled into 2021 and influenced the way consumers interact with various brands.
At the start of March 2021, GeoPoll undertook a national media establishment survey to inform the station mapping used in our daily GeoPoll Audience Measurement (GAM) surveys.
Survey Methodology
The survey was national for a sample of 1905 respondents. The male/female split was 54%/46%, respectively. The age distribution was 15-24 (31%), 25-34 (32%) and 35+ (37%). The study covered all the 11 media topographies in Kenya and was carried out via Mobile SMS.
This article highlights some interesting findings from a part of the survey data. It covers the below information areas:
- Past 30 days media interaction for selected media, including by age, gender, and parental status.
- Radio listenership places and platforms/devices.
- TV viewership places and platforms/devices.
- An overview of social platforms.
Access to Media in the Last 30 Days
The media landscape has been shifting over the years especially following the digital migration, increased access to the internet and digital platforms, and continued proliferation of mobile devices. This has led to the fragmentation of audiences.
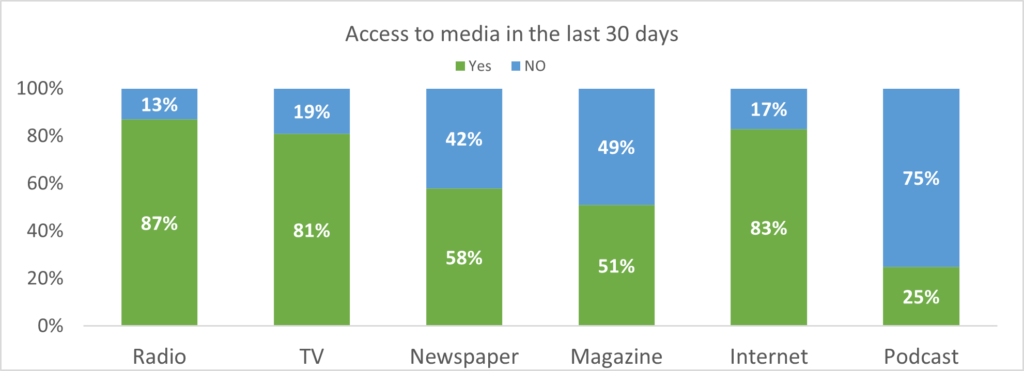
Radio was the most accessed form of media, with about 9 in every 10 respondents in the survey having accessed radio in the last 30 days. The internet has caught up with TV. For both media types, 8 in every 10 people had access in the last 30 days. According to the Communication Authority (CA), there were 44.4 million data/internet subscriptions during the second quarter of FY 2020/2021 in Kenya. CA reports that internet usage is expected to continue “evolving rapidly” with increasing innovation in technology, availability of more affordable smartphones in the market, and enhanced connectivity (3G, 4G, and 5G) in the country.
Print readership is accessed by just above half of the sampled respondents. On the other hand, podcasts are still niche, with ¼ of respondents saying they had listened in the last 30 days. Amongst the 3 in every 4 who had not listened to a podcast, close to 60% do not recognize what a podcast is.
Access to Media in the Last 30 Days by Gender
Media use incidence varies for some media by gender. Males recorded higher access to the Radio (+6%) compared to females. This was further differentiated in newspaper readership where +9% more males were recorded juxtaposed to females.

Just about +5% more males access the internet over the last 30 days compared to females. TV, Magazine, and Podcast access incidences were the same for either gender.
Access to Media in the Last 30 Days by Age
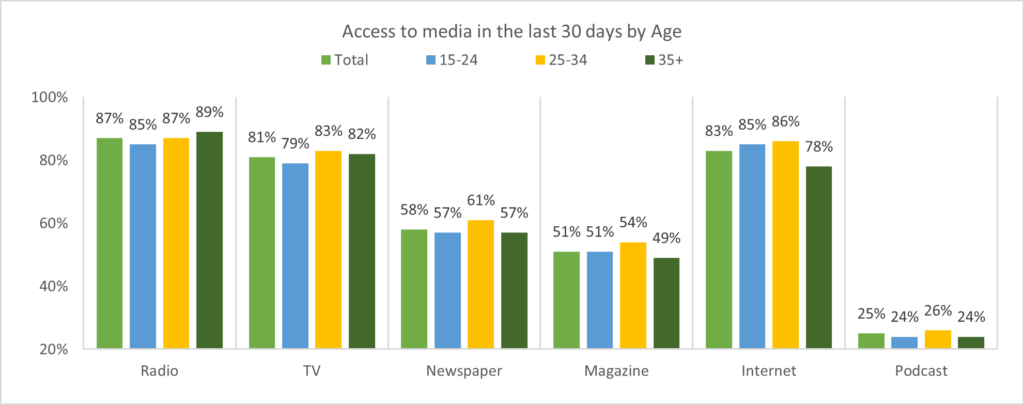
While being high (above 80%) across all age groups, radio listenership had a higher skew as respondents get older. TV viewership also recorded higher numbers amongst those aged 25-34 & 35+ compared to the younger 15–24-year-olds.
Print media – newspapers and magazines – are more popular amongst those aged 25-34 years. Past 30 days internet usage as expected is higher amongst the younger age groups 15–24-year-olds and 25–34-year-olds than those aged 35+.
Access to Media in the Last 30 Days by Parental Responsibility
Across all media channels, parents/caregivers index higher media usage compared to those who were not: Radio (+9%), TV (+12%), newspaper (+10%), Magazines (+15%) and Internet (+6%).
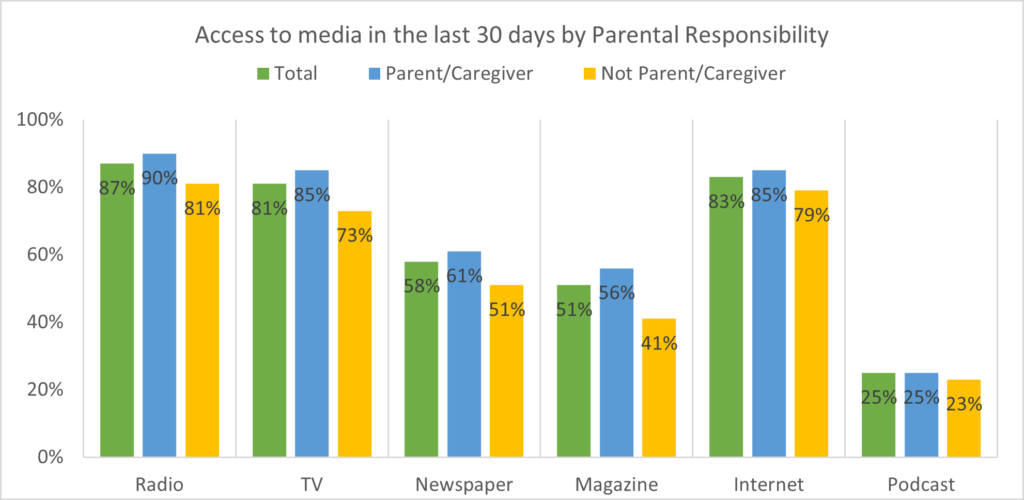
In this survey, parents/caregivers were defined as parents/caregivers of a child/children 14-years-old or younger. Higher media usage amongst this demographic could be linked to the need to provide their children with entertainment/edutainment at home.
Radio Listenership Dynamics
Radio listenership predominantly happens at home. Outside the home, people reported listening to the radio at work or in transit/in a vehicle. There were recorded differences in places of listenership by age, gender, and location (Request for the data ?)

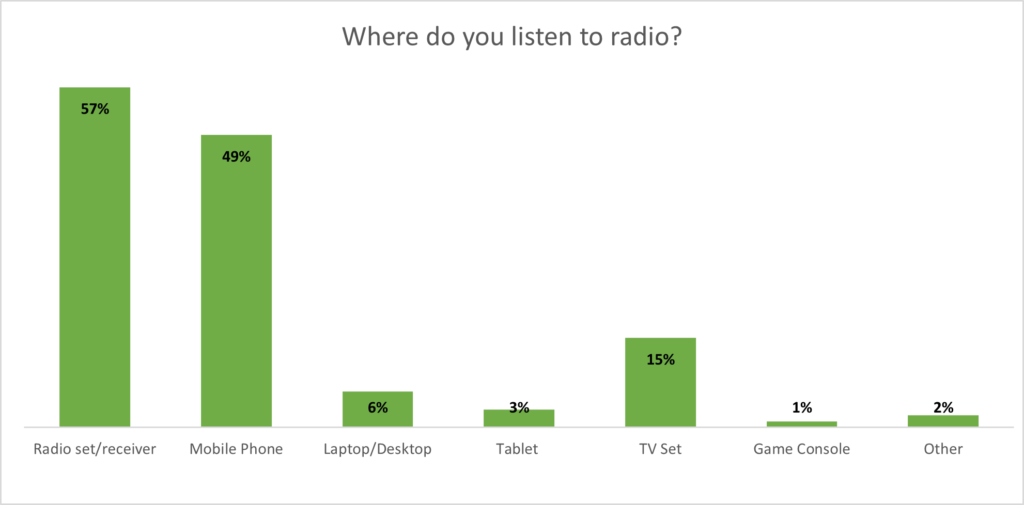
Traditionally, radio listenership was done via a radio set/receiver, especially at home. Despite about 80% of listenership happening at home, device usage is split between radio set/receiver (57%) and mobile phone (49%). With internet access reported to be high (at par with TV), the mobile device presents an excellent opportunity for broadcasters to optimize how they deliver radio content. The use of mobile apps and streaming services should be proactively explored. There were recorded differences in device usage by age, gender, and location. (Request for the data ?)
TV Viewership Dynamics
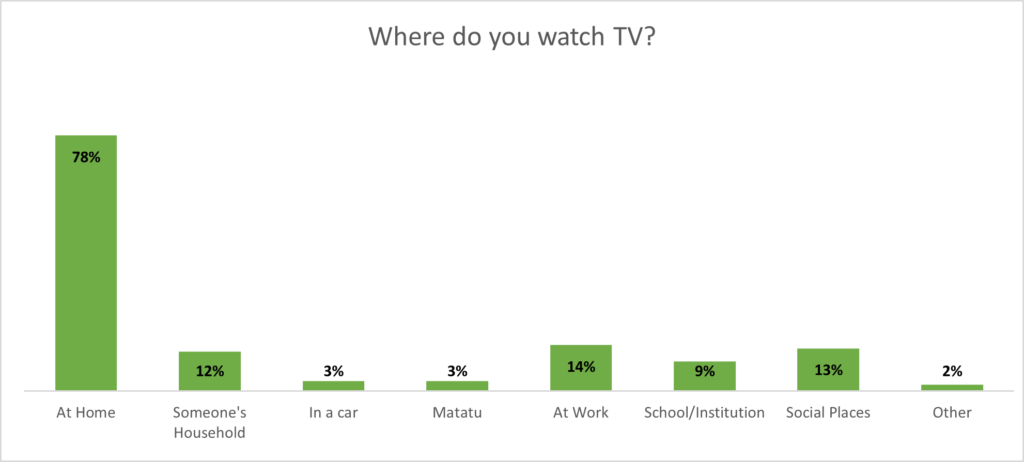
Like radio, TV viewership is mainly done at home, unlike radio rarely on the go. This makes TV viewership patterns a little more predictable across the day compared to Radio. There are differences in at-home compared to out-of-home viewership by gender with men. For instance, men are twice as likely to be watching TV social places than females.
Television viewership is predominantly via the TV set. While the numbers are not as high for mobile phone viewership (21%) compared to radio, this is expected to rise in the future. Increase in internet connectivity especially home broadband, and the need for split screens would likely drive this. However, this will occur in an ecosystem (mobile device) that will be crowded with options for the consumer. TV channels would not only be competing amongst themselves but also with other media, including radio, video-on-demand/streaming services, social media, and other apps and functions for a share of the mobile screen.
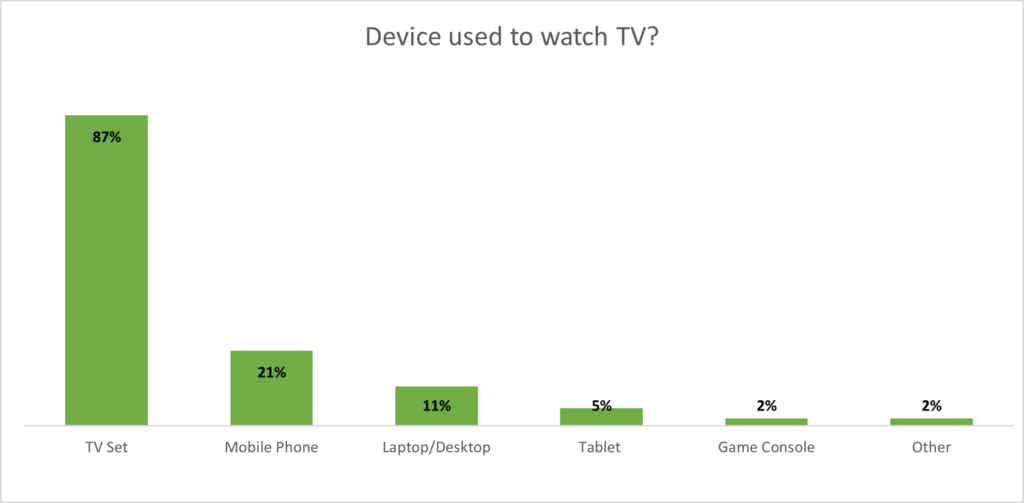
Besides looking at the above data for TV by demographics, we also collected data on the platform used for TV broadcast and the type of television broadcast. (Request for the data ?)
Social Platforms Overview
Overall internet access is high as reported earlier. According to the CA, internet access in Kenya has mainly been driven by the availability of more affordable smartphones and enhanced connectivity. There has also been a recorded increase in home broadband connectivity. We sought to find out the most used social platforms and found that WhatsApp (82%) recorded the most use in the last 30 days followed by Facebook (75%). (Request for the data ?)
Conclusion
In conclusion, the media landscape is evolving rapidly, and GeoPoll will continue keeping a pulse on it. Through our daily GAM surveys, we track TV viewership and radio listenership every 30mins and 2 hours, respectively. This data is available off the shelf and can be accessed at any time. Contact us to get in touch with one of our representatives for a demo. Using our various remote data collection platforms: Mobile SMS, Mobile Web, Telephonic calls/CATI, and Mobile App, GeoPoll is able to support any client to reach consumers rapidly via dedicated panels/one-off Adhoc surveys.
